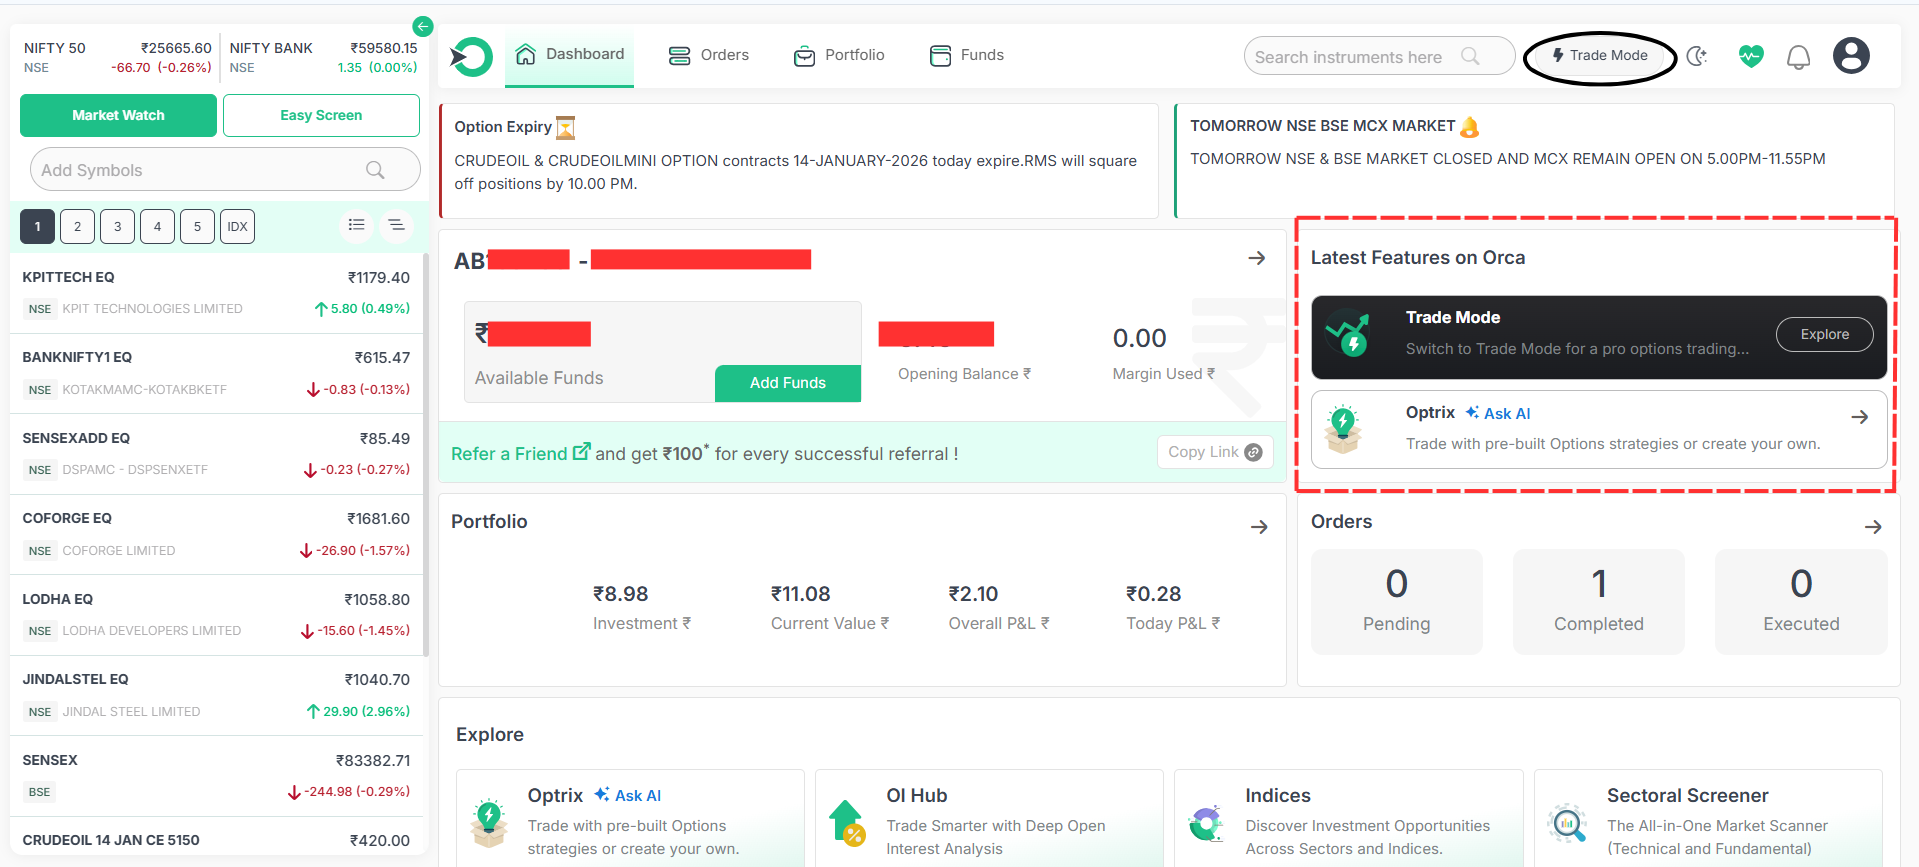
How to Use Trade Mode in ORCA
Open the ORCA App
Log in to the ORCA app using your registered mobile number or credentials.
Switch to Trade Mode
On the home screen, select Trade Mode.
This mode is designed for live order execution (Buy / Sell)
Trade mode will be opened .
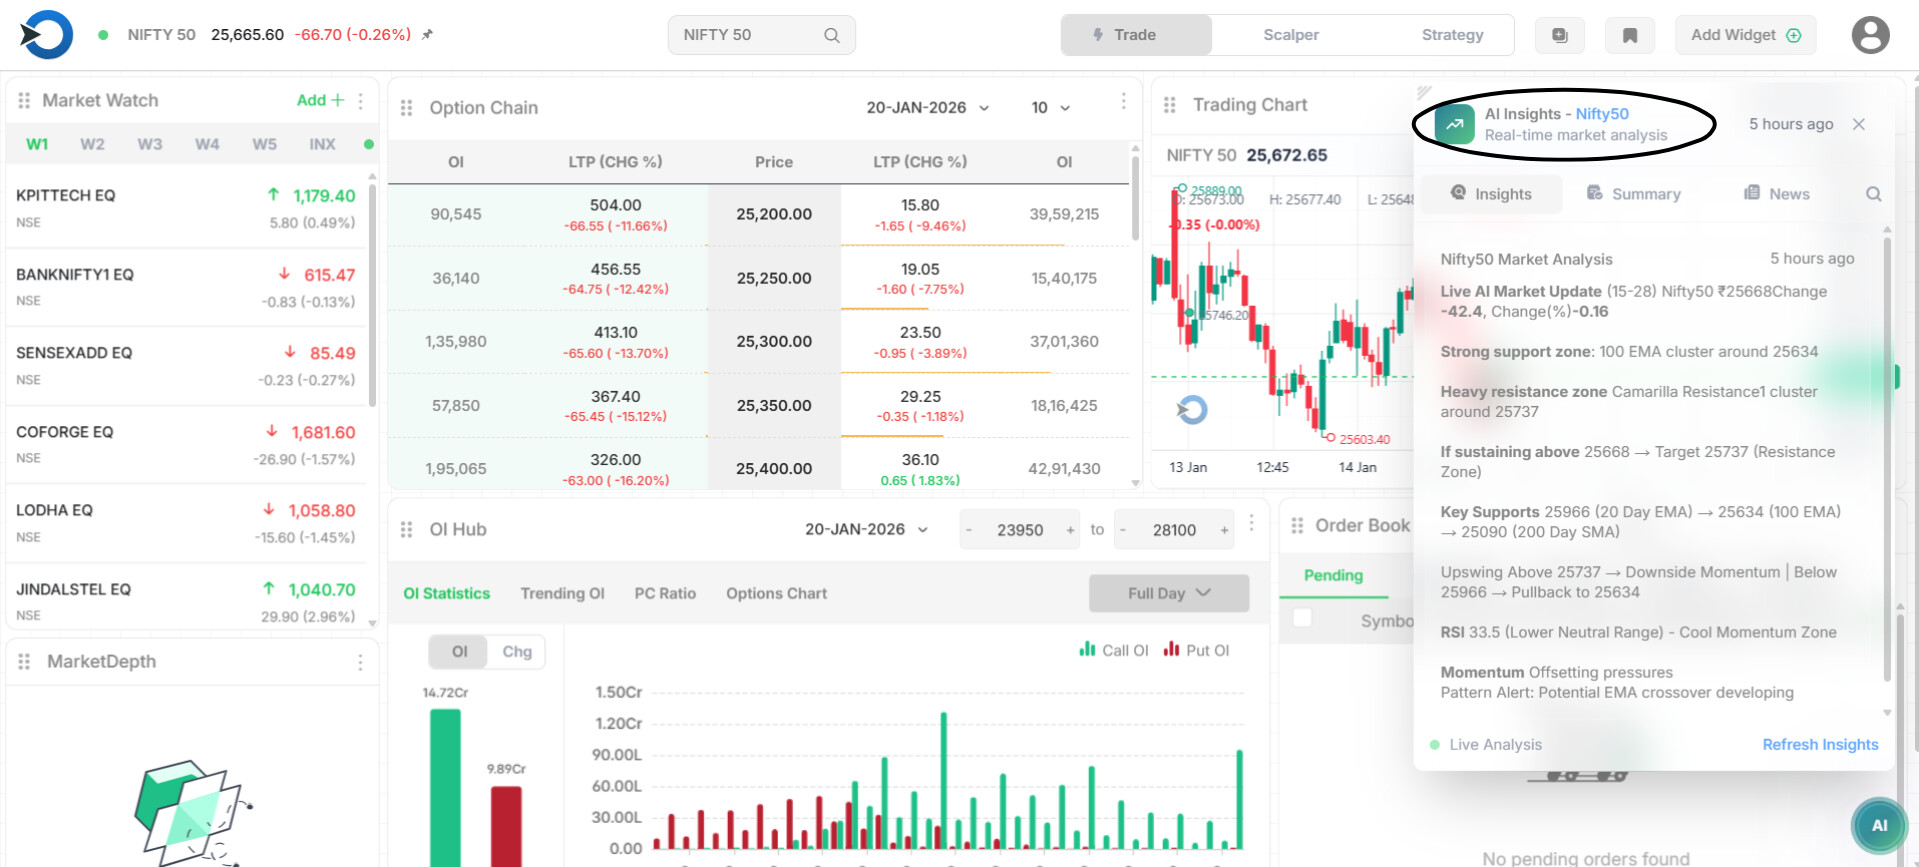
AI Insights (reduce the manual technical works in simply form)
AI Insights gives a ready-made market view using real-time data.
-
Current market bias (bullish / bearish / sideways)
-
Important support levels
-
Important resistance levels
-
Short-term direction & momentum
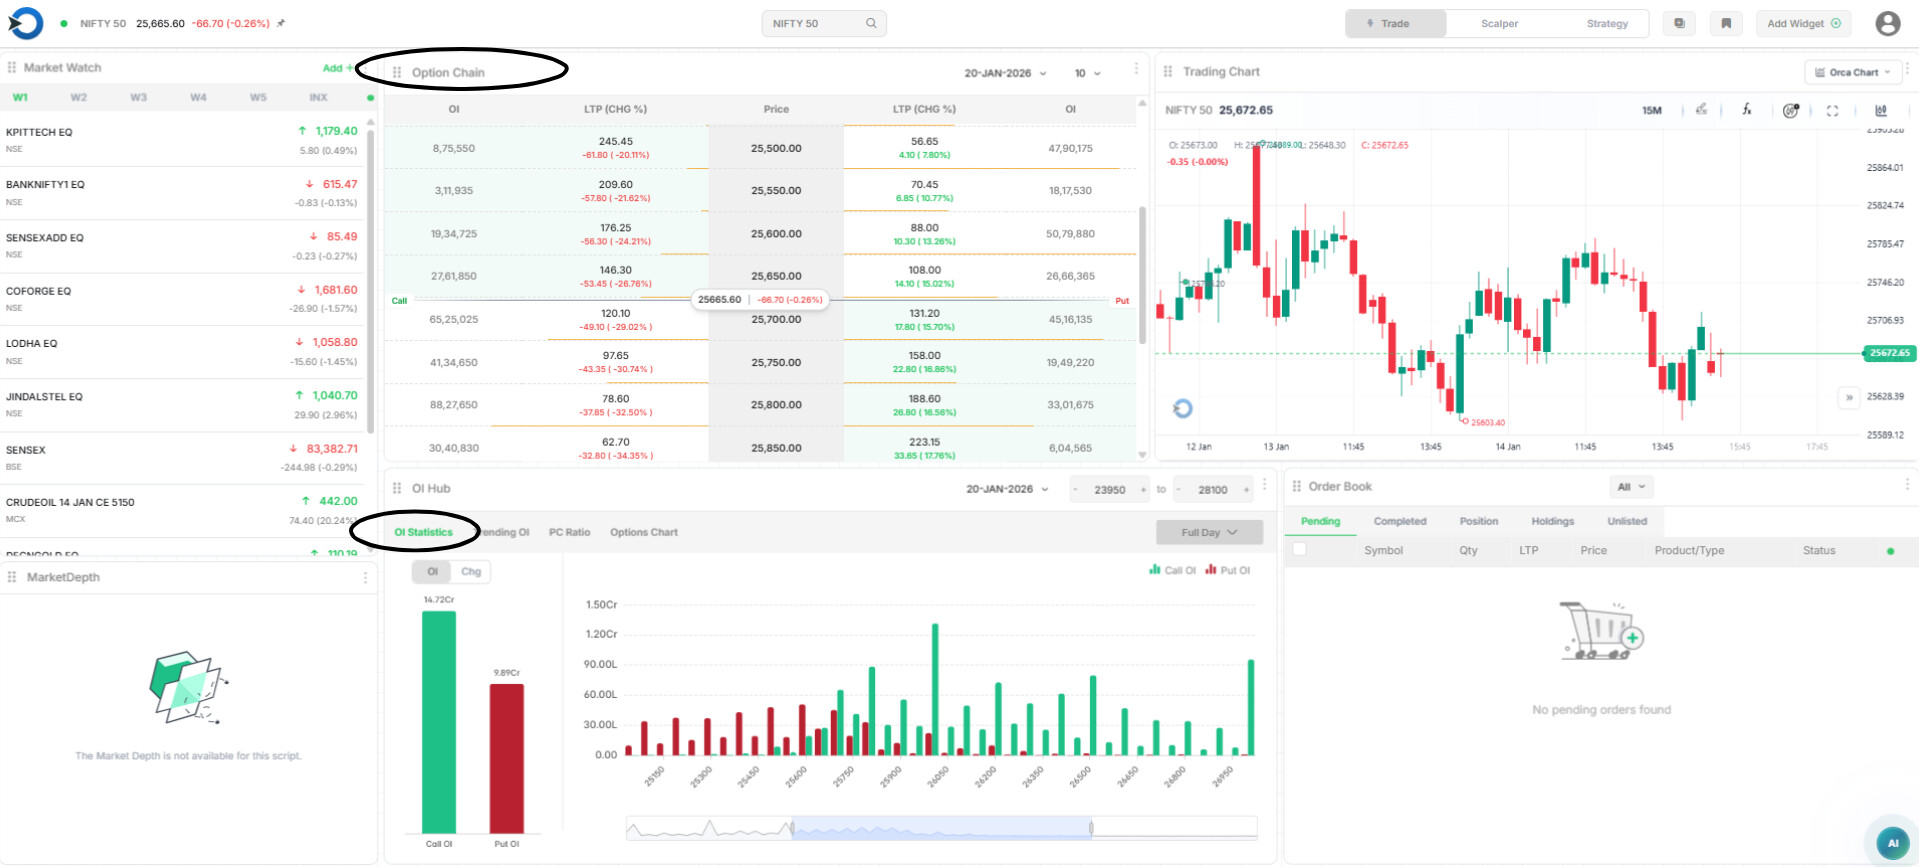
How to Use Option Chain
The Option Chain shows all Call (CE) and Put (PE) option data.
-
Middle Column (Strike Price)
This is the price level at which options are available . -
Left Side – Call Options (CE)
Used when traders expect the market to fall or stay below a level. -
Right Side – Put Options (PE)
Used when traders expect the market to rise or stay above a level. -
LTP (Last Traded Price)
Shows the current price of that option. -
OI (Open Interest)
Shows how many contracts are open at that strike.
How Should Read OI
-
High Call OI → Strong resistance zone
-
High Put OI → Strong support zone
-
If Call OI is increasing, sellers expect downside
-
If Put OI is increasing, sellers expect upside
OI Statistics – Market Strength at a Glance
-
Green Bars (Call OI)
-
Red Bars (Put OI)
-
Taller bar = stronger position buildup
If Put OI > Call OI → Market bias is bullish
If Call OI > Put OI → Market bias is bearish
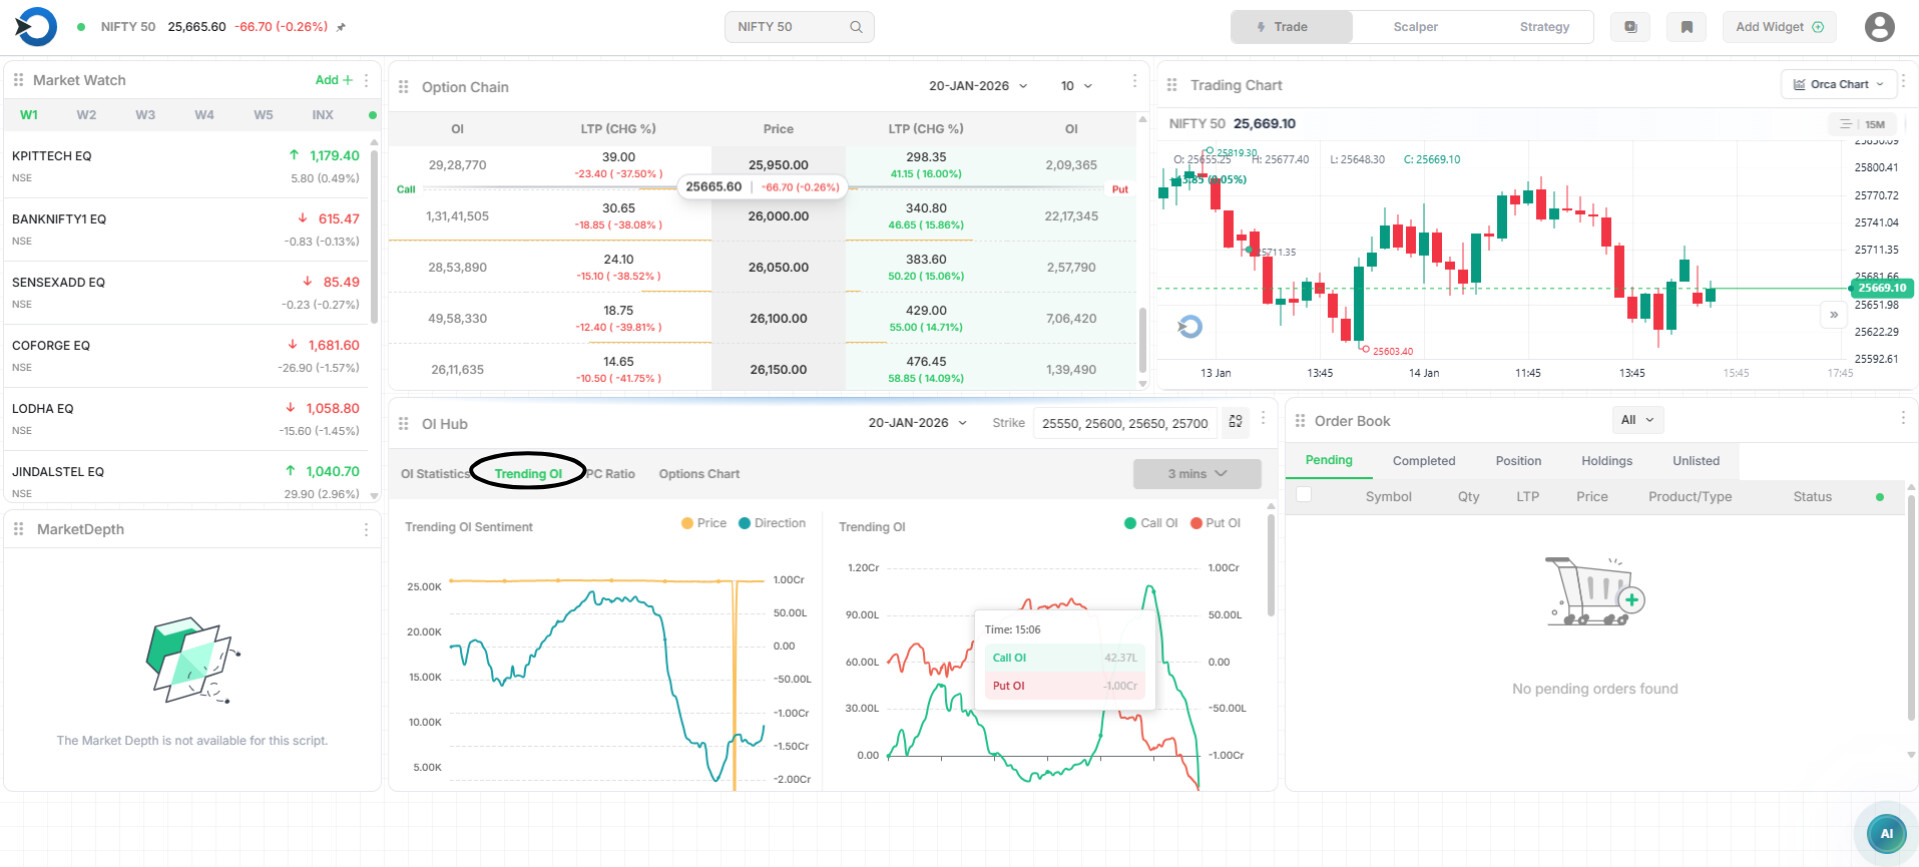
Trending OI
Trending OI shows where traders are adding or exiting option positions in real time with selected strikes
OI Sentiment – Price & Direction
 Price Line
Shows how NIFTY price is moving.
Direction Line
Shows option position direction (based on OI change).
How to read it.
-
Price up + Direction up → Bullish sentiment
-
Price down + Direction down → Bearish sentiment
-
Price flat + Direction moving → Positions building
-
Direction falling sharply → Position exit / reversal warning
Trending OI
-
Trending OI shows how Call OI and Put OI are changing in real time.
-
Green line = Call OI
-
Red line = Put OI
How to read it:
-
Call OI rising → More call positions → Resistance / bearish pressure
-
Put OI rising → More put positions → Support / bullish pressure
-
Both rising → Market likely sideways
-
Both falling → Traders exiting → Big move possible
-
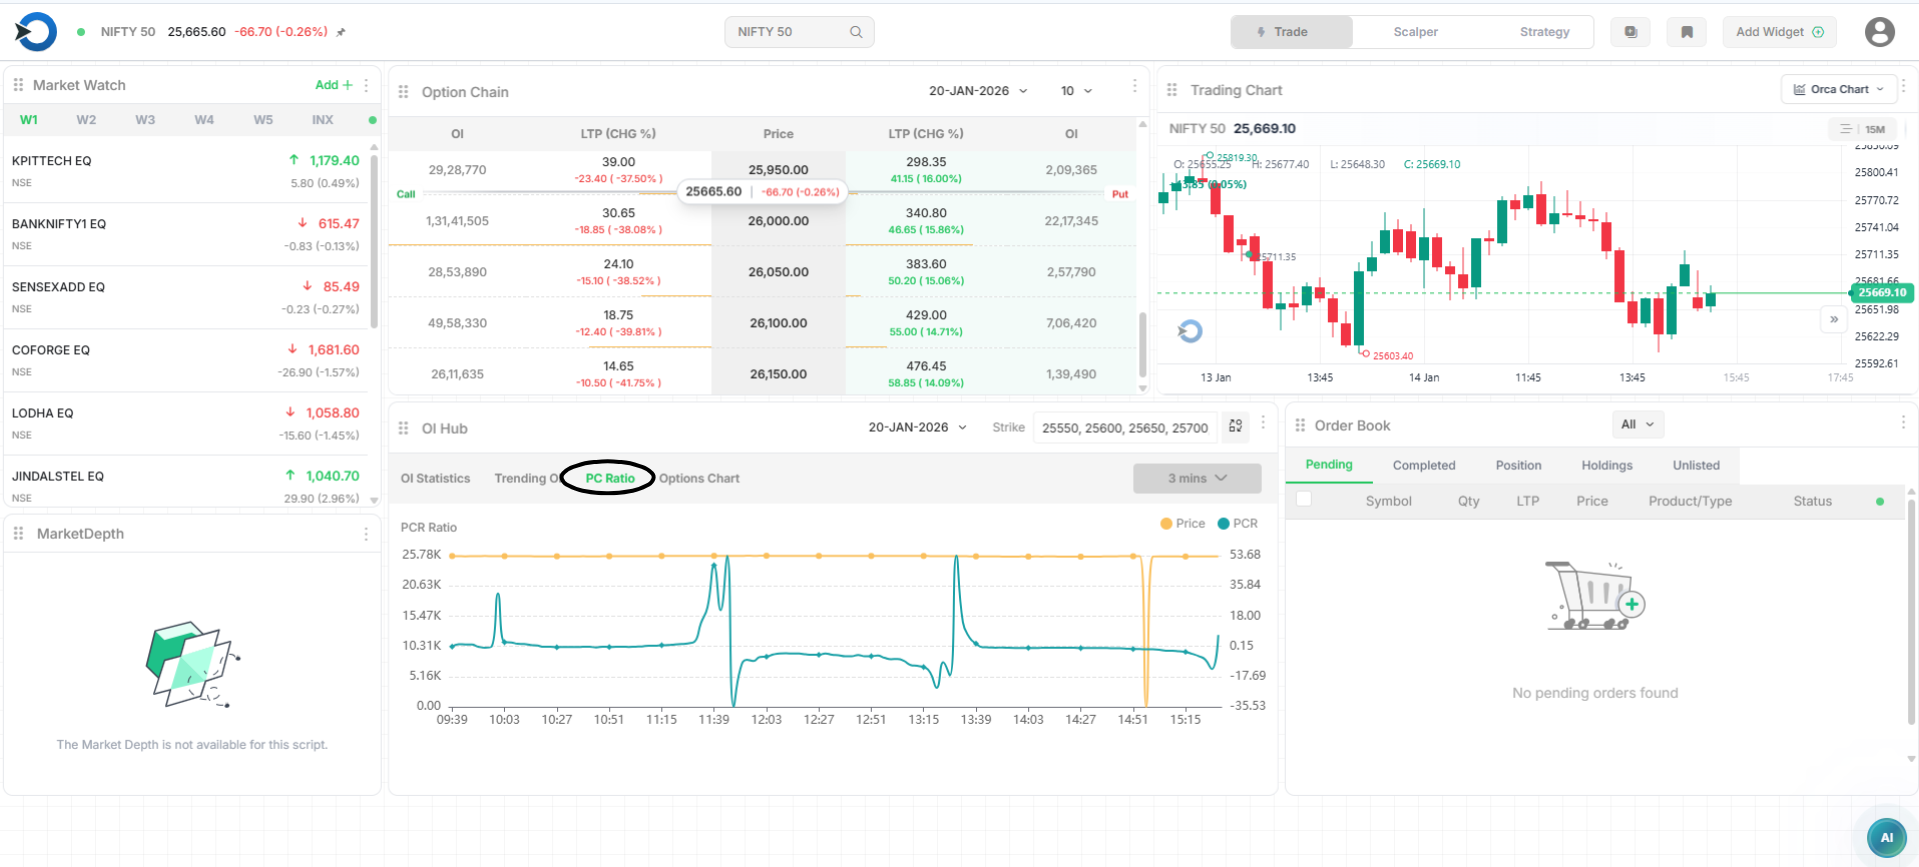
PCR Ratio
PCR (Put-Call Ratio) shows whether Put options or Call options have more positions.
-
PCR > 1 → More Put positions → Market support / bullish bias
-
PCR < 1 → More Call positions → Market resistance / bearish bias
-
PCR near 1 → Market likely sideways
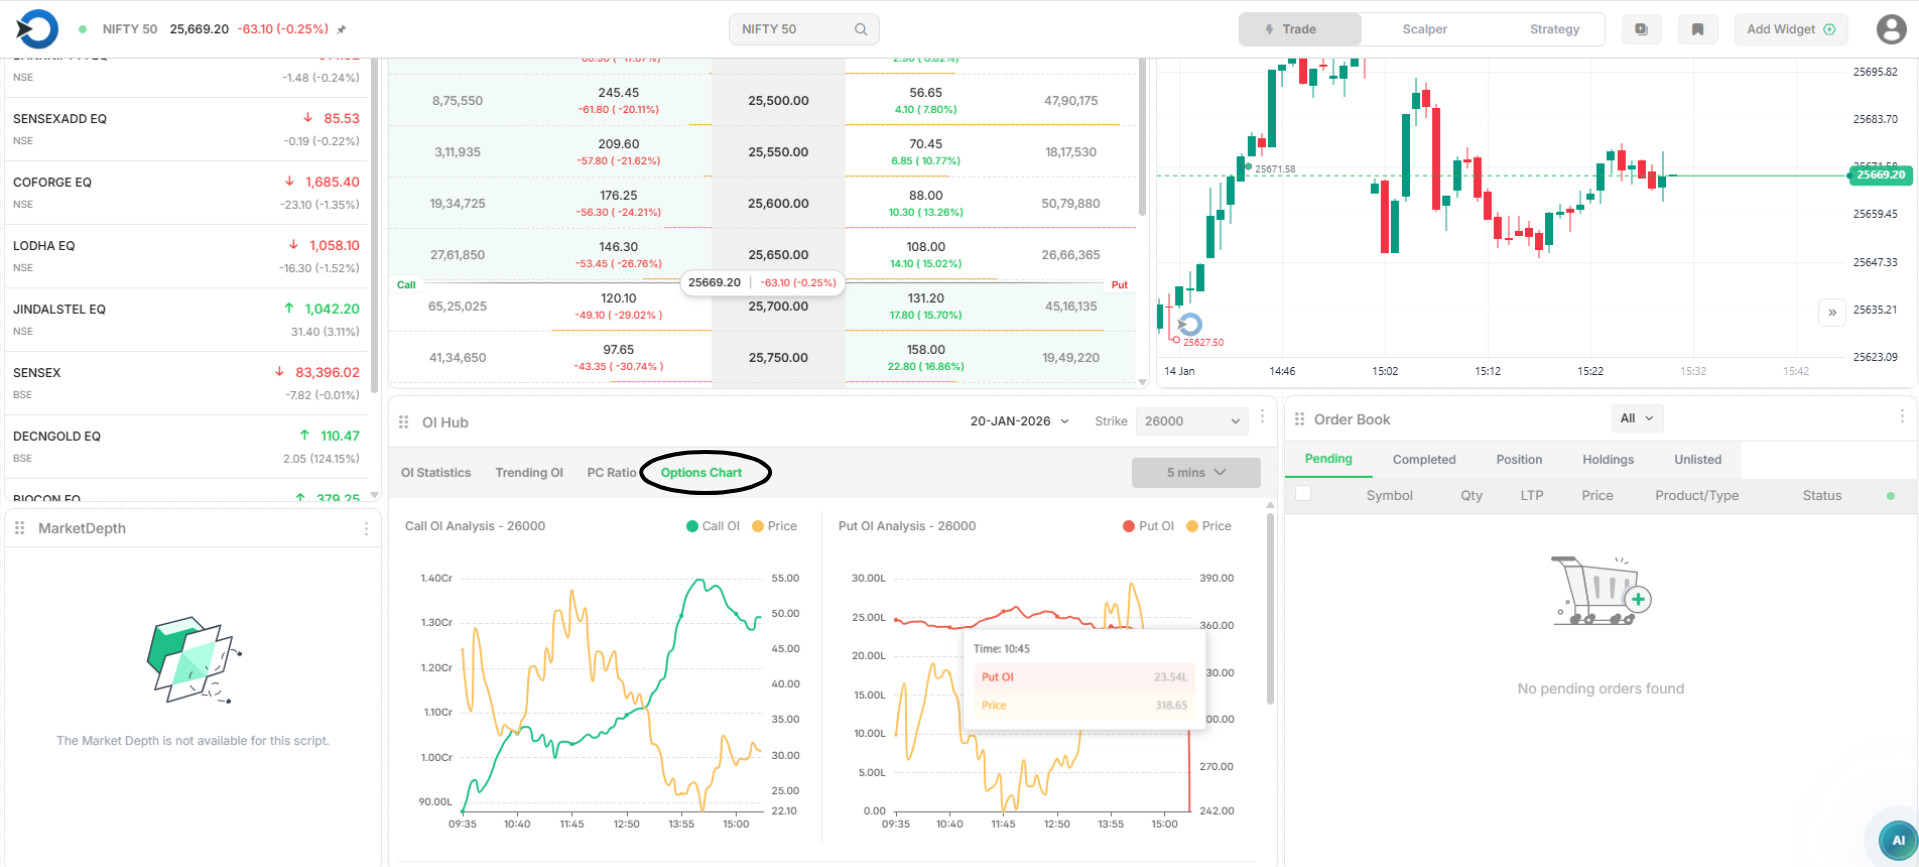
Options Chart
Options Chart shows how option price and Open Interest (OI) are moving together for a selected strike price.
How should read it:
-
Price up + OI up → Fresh buying / strong interest
-
Price down + OI up → Selling pressure
-
OI falling → Traders exiting positions
Traders can use all features in one place without distraction.
This creates a clear trading mindset, making decision-making easier.
With everything visible on a single screen, order execution becomes faster and smoother, helping traders react quickly to market moves.