Technical indicators are tools traders use on charts to understand trend, momentum, and possible future price behavior. They don’t predict the market perfectly, but they help simplify price action and make better decisions. For beginners, indicators work best when used to support what the price is already showing, rather than replacing it.
Different indicators serve different purposes:
-
Some show momentum (how strong buying/selling is)
-
Some show trend direction
-
Some warn about overbought/oversold conditions
-
Some help find entries and exits
1. RSI (Relative Strength Index)
What it tells you:
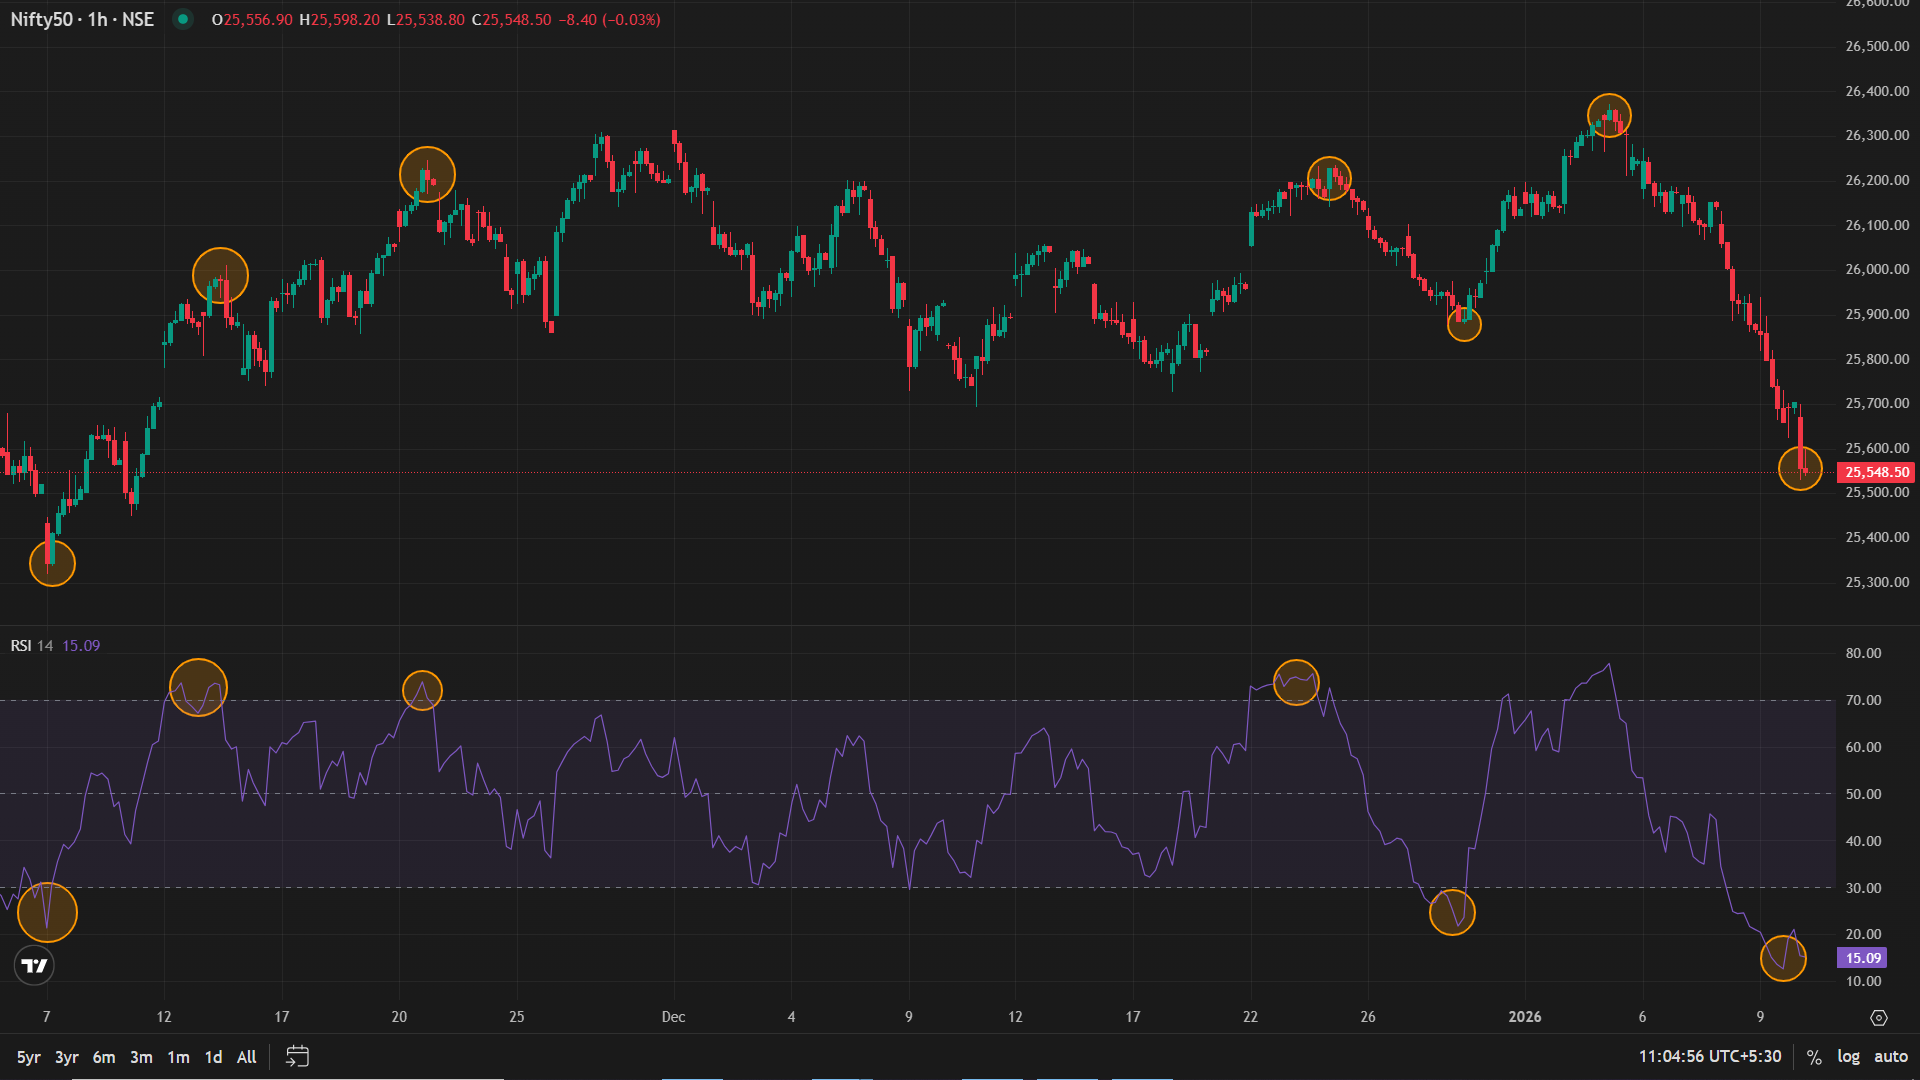
RSI measures momentum, whether a stock/index is getting bought or sold too aggressively.
Basic interpretation
-
RSI above 70 = Overbought – Price may cool down / pullback
-
RSI below 30 = Oversold – Price may bounce / reverse up
-
RSI 50–60 = Neutral zone – Trend unclear, sideways
Practical usage for beginners
![]() Identify reversals:
Identify reversals:
-
Oversold (RSI < 30) – Watch for bounce
-
Overbought (RSI > 70) – Watch for profit-taking
![]() Find trend strength:
Find trend strength:
-
Uptrend: RSI often stays above 60
-
Downtrend: RSI stays below 50
![]() Avoid trap signals:
Avoid trap signals:
-
In strong uptrend, RSI can stay overbought for days – not a sell signal alone
-
In strong downtrend, RSI can stay oversold
Tip: RSI works best when combined with support/resistance.
2. Moving Averages (MA)
Common types beginners use:
-
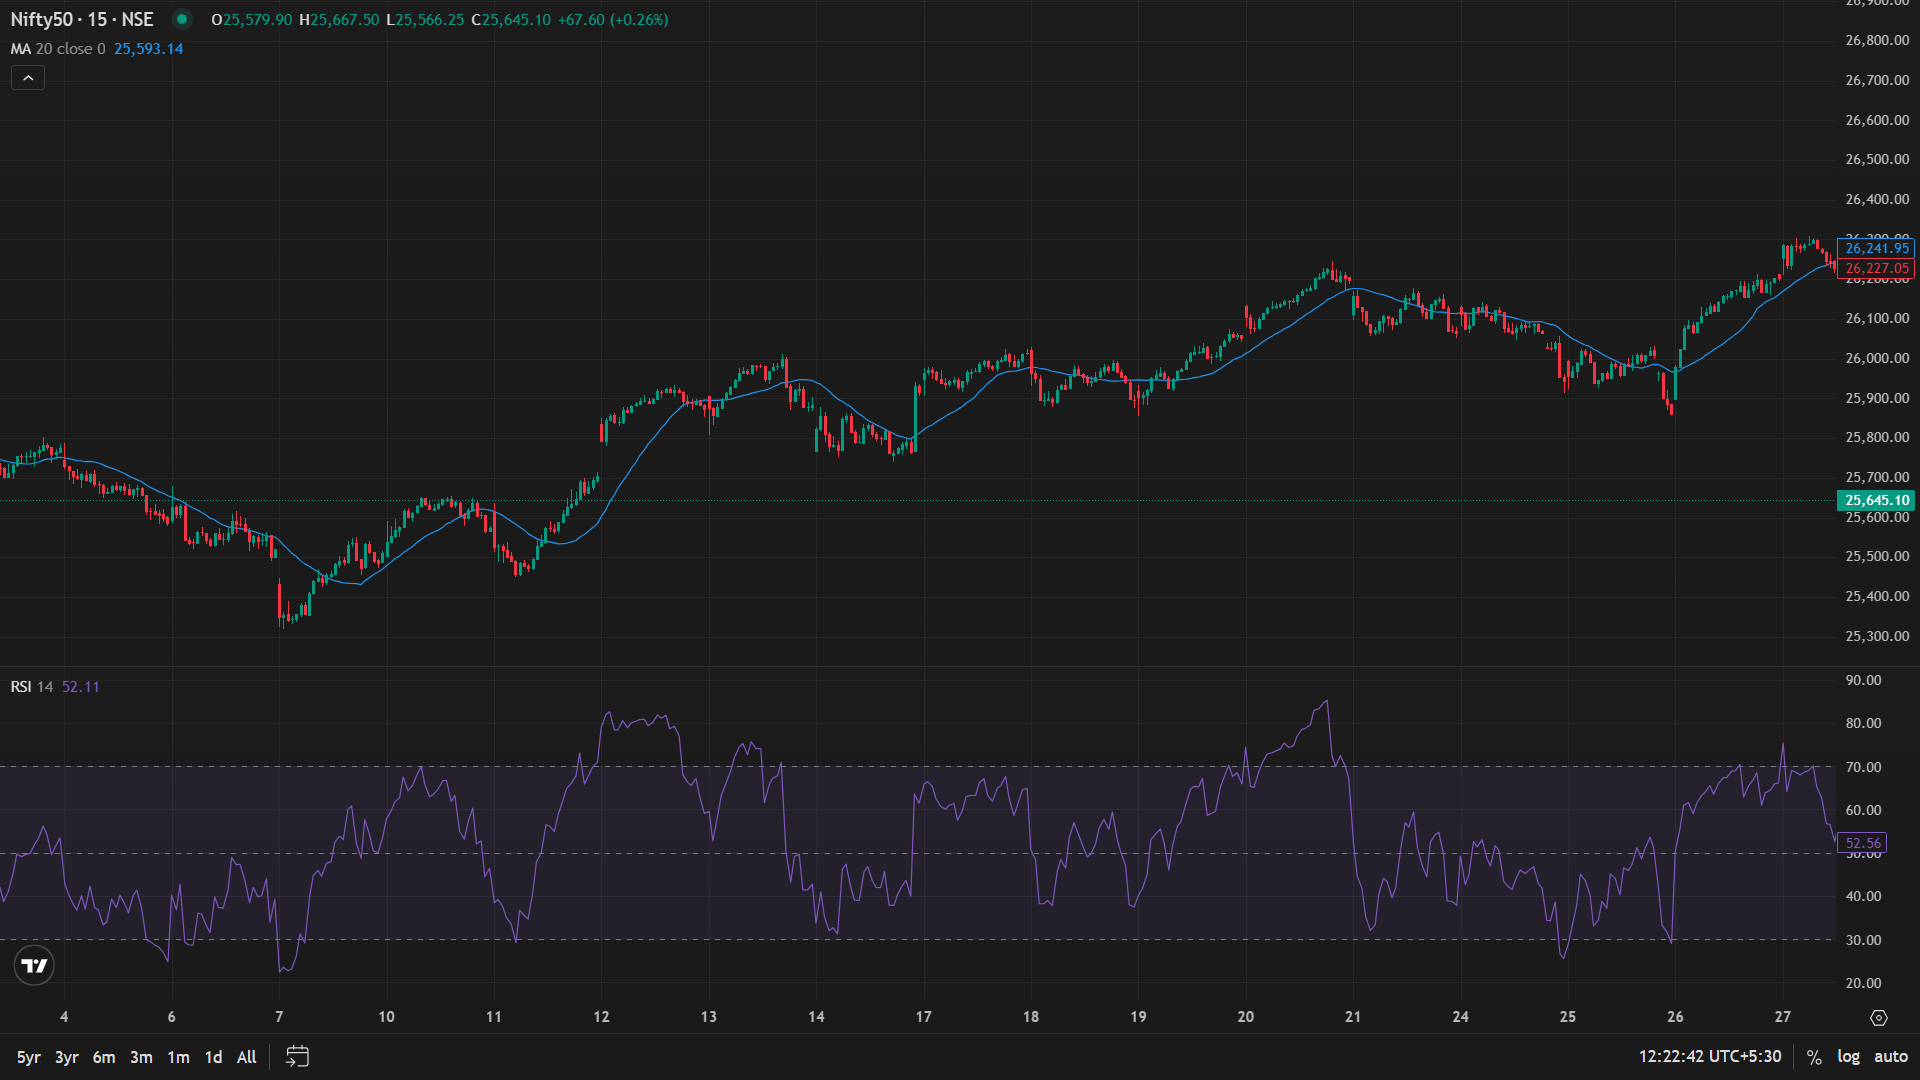
20-day MA – short-term
-
50-day MA – medium-term
-
100 & 200-day MA – long-term trend
What MAs help with
![]() Identify trend direction
Identify trend direction
![]() Spot dynamic support & resistance
Spot dynamic support & resistance
![]() Generate trend-following entries
Generate trend-following entries
Practical usage
![]() Trend Identification:
Trend Identification:
-
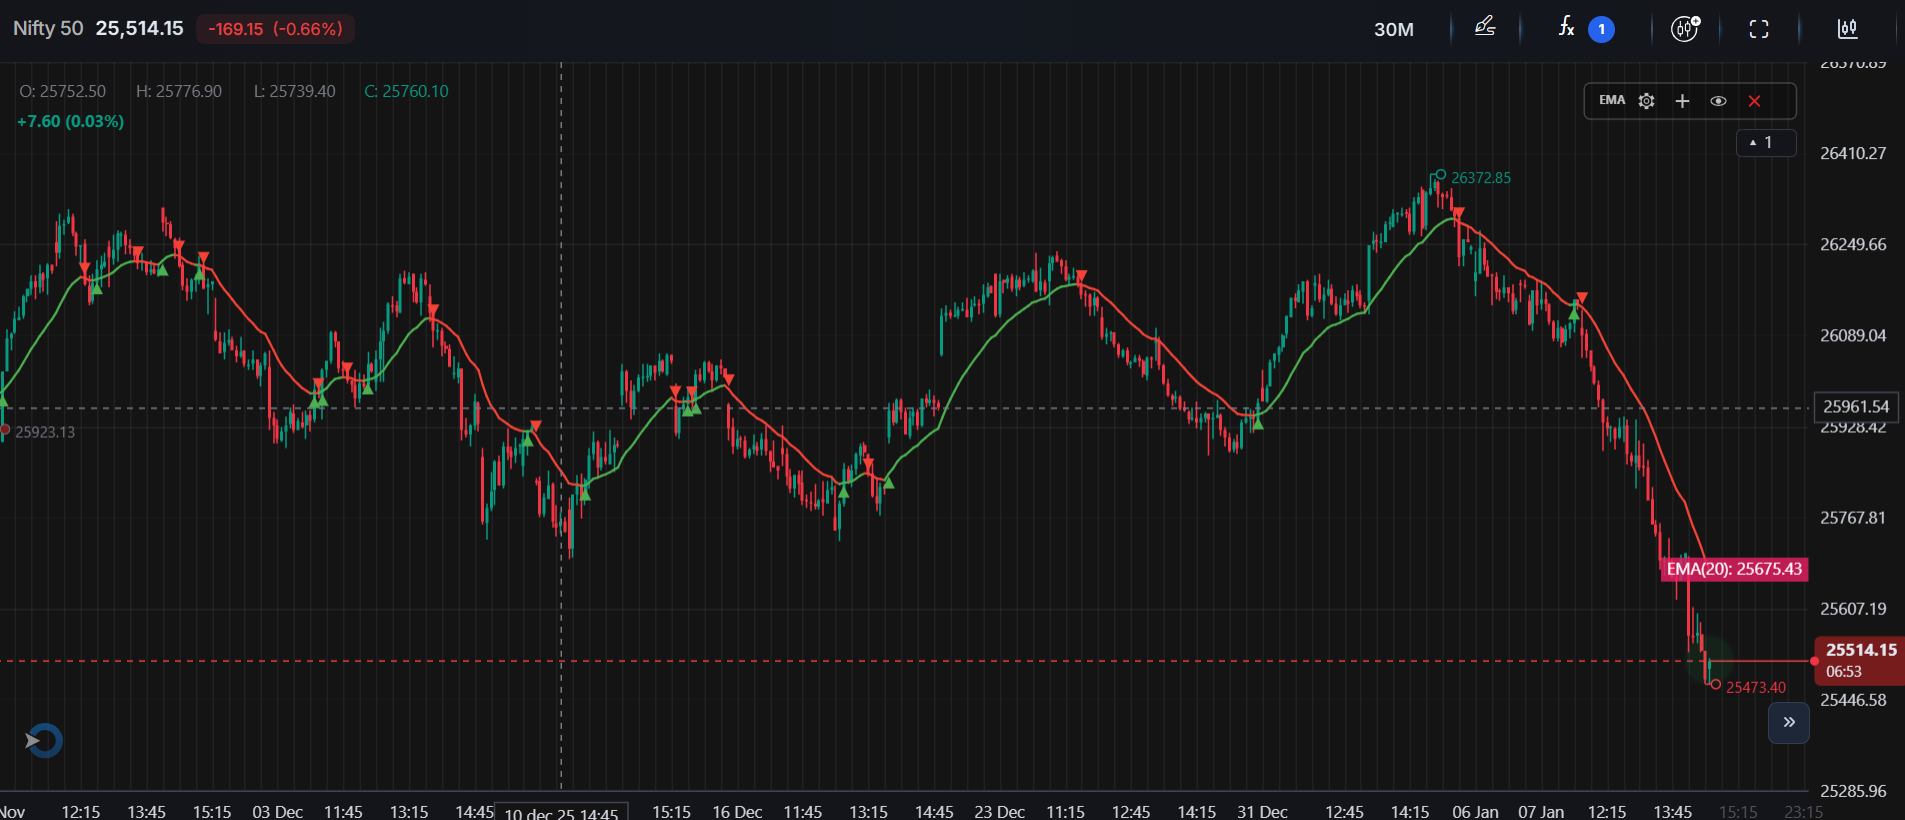
Price above MA – Trend is bullish
-
Price below MA – Trend is bearish
![]() Major Support/Resistance:
Major Support/Resistance:
- Price often reacts near 50/100/200 MAs
Example:
Nifty bouncing near 100 EMA = Bulls defending trend
![]() MA Crossovers (simple strategy)
MA Crossovers (simple strategy)
-
Golden Cross: 50 MA moves above 200 MA – Bullish
-
Death Cross: 50 MA moves below 200 MA – Bearish
How to Combine RSI + MA (Simple System)
This is how many traders make decisions:
![]() Scenario 1: Ideal Buy Setup
Scenario 1: Ideal Buy Setup
-
Price above 50/200 MA (uptrend)
-
RSI dips near 35-45 (pullback)
– Buy the dip in uptrend
![]() Scenario 2: Ideal Short Setup
Scenario 2: Ideal Short Setup
-
Price below MA (downtrend)
-
RSI rises toward 60–70 (relief bounce)
– Short into weakness
![]() Scenario 3: Avoid Trap
Scenario 3: Avoid Trap
-
RSI oversold but price below 200 MA – Could keep falling
-
RSI overbought but price above 200 MA – Could keep running
Most Important Practical Advice
Indicators confirm, they do not predict.
Traders usually:
-
Find trend using MAs
-
Check momentum using RSI
Wait for price confirmation