USD/INR: Decade-Long Rising Structure Continues to Guide Price Action
The long-term USD/INR chart has been trading within a well-defined rising wedge structure for over a decade. Price action continues to form higher highs and higher lows, reinforcing the view that the broader trend remains firmly upward.
The recent move toward the 90–91 zone aligns well with the prevailing slope of this structure and does not indicate any structural deviation. Historically, USD/INR has consistently respected both the upper and lower boundaries of this pattern across multiple market cycles. Each major corrective phase has found support near the lower band before the broader uptrend resumed.
As observed in earlier phases, advances toward the upper boundary of the structure tend to result in temporary exhaustion. This is typically followed by periods of consolidation or corrective phases within the broader pattern, before the next leg of the trend unfolds. Over the long term, this structure has shown a strong tendency to repeat this behaviour.
At current levels, USD/INR is positioned in the upper half of its long-term rising structure, indicating trend continuation rather than a breakdown. There has been no violation of the pattern and no formation of lower lows, suggesting that the move remains controlled, orderly, and structurally intact.
Long-Term Technical Levels
The 88.00–86.50 zone represents the immediate support area, aligning with the lower boundary of the rising structure and consistently acting as a long-term demand zone. A decisive break below this band could expose the 85.00 level, which has historically served as an important intermediate support, absorbing deeper corrective phases.
On the upside, the 91.00–92.00 range marks a key resistance and expansion zone near the upper boundary of the structure. A sustained move above this region would open the door to the next structural target zone of 94.00–96.00 over the medium term. This higher band also serves as a psychological reference for the longer term, contingent on a meaningful expansion of the upper boundary.
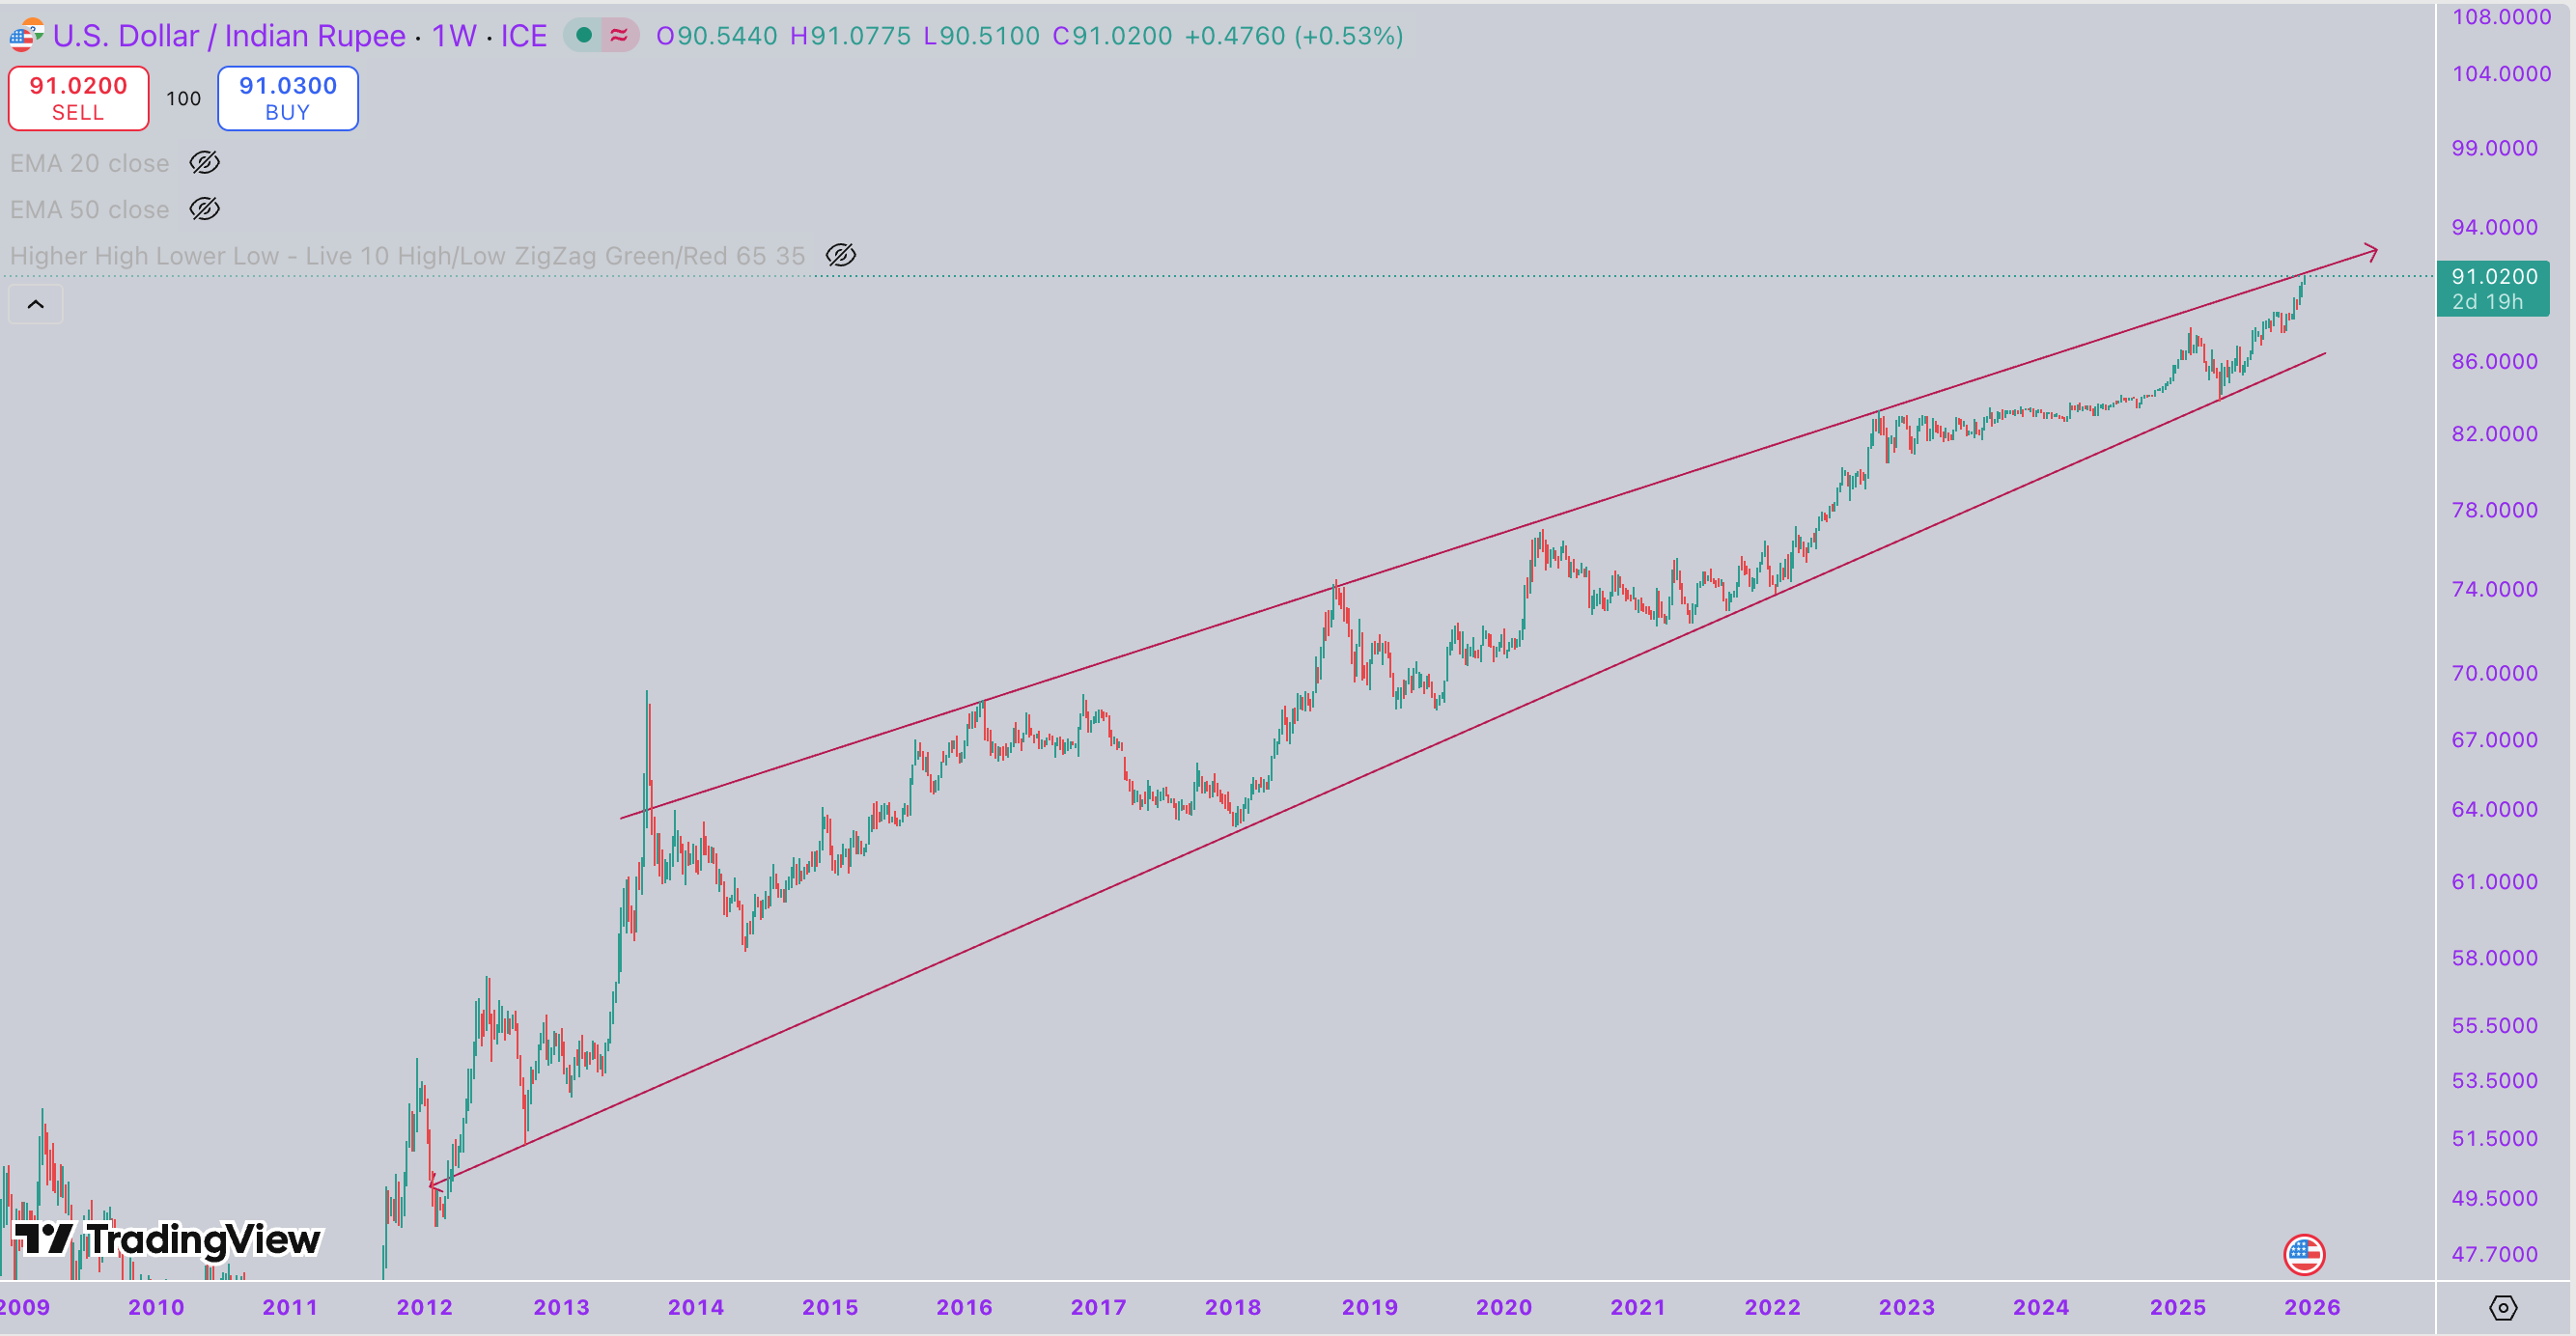
Each major correction in the past—during 2012, 2014, 2017, 2020 and 2022—found support at the lower boundary of the structure, reinforcing its role as a critical long-term demand zone. Similarly, the upper boundary has been tested multiple times, including in 2013, 2016, 2020, 2022, and again in the current phase, underscoring its significance as a key long-term resistance area.
If the upper boundary is respected once more, a phase of consolidation or correction within the structure would be the natural outcome. Conversely, a decisive breakout above the long-term resistance line would signal the start of a new structural phase, setting a fresh trajectory and redefining future resistance zones.
The long-term structure remains intact as long as USD/INR stays above the lower boundary of the ascending channel. Within this framework, pullbacks are better interpreted as corrective pauses rather than trend reversals. The dominant chart structure continues to favour a gradual, sustained upswing over time.
This outlook would change materially only in the event of a decisive breakdown below the rising structure. Until then, the broader market setup continues to reflect a structurally strong US dollar and a gradually depreciating rupee, consistent with the long-term trend depicted on the chart.